

Menu
Calendar
March 2026 M T W T F S S « Mar 1 2 3 4 5 6 7 8 9 10 11 12 13 14 15 16 17 18 19 20 21 22 23 24 25 26 27 28 29 30 31 Search This Blog
Archives
- March 2025
- February 2025
- January 2025
- December 2024
- November 2024
- March 2022
- April 2017
- June 2015
- May 2015
- April 2015
- March 2014
- February 2014
- January 2014
- November 2013
- September 2013
- August 2013
- May 2013
- April 2013
- March 2013
- January 2012
- December 2011
- November 2011
- October 2011
- September 2011
- August 2011
- July 2011
- June 2011
- May 2011
- April 2011
Pages
Meta
Tax Advantage of Modified Covered Call
My Modified Covered Call approach also has a huge tax advantage over conventional investment style including covered calls. I’ll describe it in more detail in the future.
Posted in Uncategorized
Leave a comment
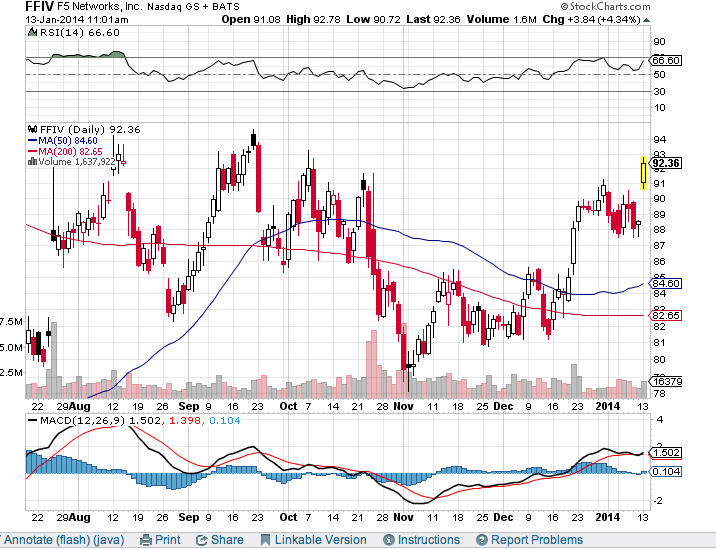
Credit Spreads of FFIV
My FFIV Jan. 18th 2014 short calls (part of the covered call) are expiring in a few days. It’s deep ITM now. I see 2 ways to roll this up.
1. Credit spread of $80 (1/18/14) to $85 (7/19/14): net credit of >$1/sh. 24.7% x 2 = 49%/yr.
2. Credit spread of $80 (1/18/14) to $90 (1/19/15): net credit of >$2/sh. ROI: 49%/yr.
The ROI is very similar, however, the 1st choice is much safer (with a deeper ITM call).
Posted in Daily Journal
Leave a comment
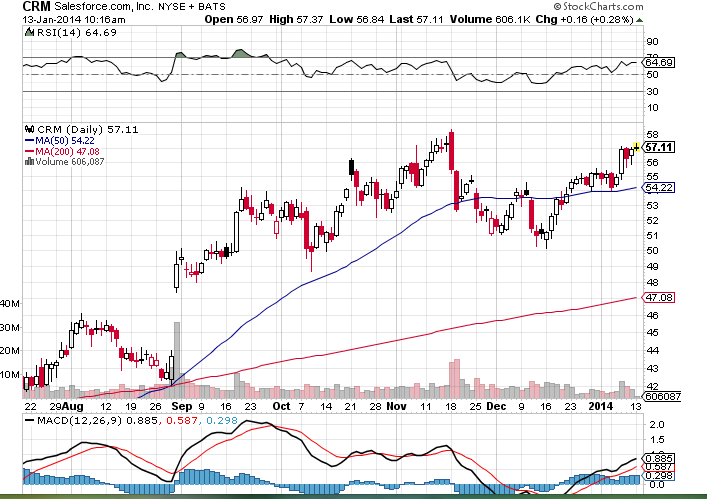
CRM: ITM credit spread, yielding 25% annual return
My CRM (now at $57.17) short call of $43.75 (part of the covered call) contracts are due to expire this Friday. CRM’s 200 day MA is ~$47. Since 43.5 is too deep ITM, I want to raise the strike price to produce more time value but still within safe limits (below $47, the 200 day MA, in this case). So I bought back 43.75 call (Jan. 18th, 2014) and sold equal number of Jan. 17th, 2015 $46.25 for -.78/sh. If CRM stays above $46.25/sh by Jan. 17th, 2015, my gain is 25%/yr for my investment. This trade is also quite safe (see chart below).
Posted in Daily Journal
Leave a comment
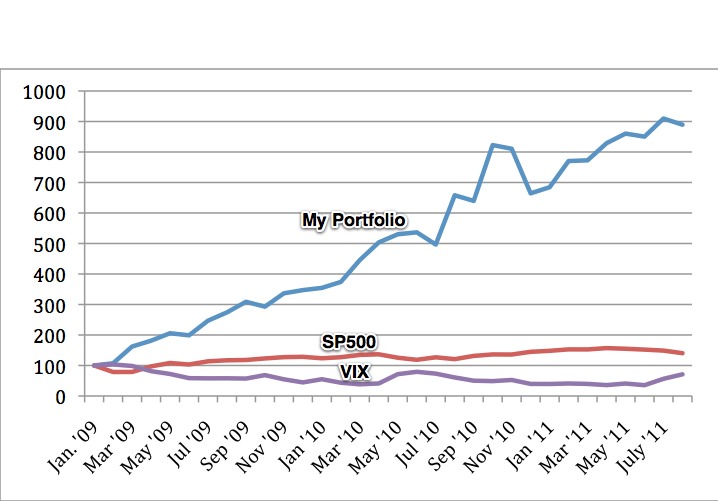
My Portfolio Performance:
Account Performance
Note: after the initial 2 years of bull market, I have accumulated a nice portfolio. Since 2011, I began to change my approach to a safer and more steady growth rather than taking high risks aiming for high gains. Due to this change, my account performance tends to outperform S&P in years when the market is down or moderately up. I expect my account to slightly underperform S&P when market is strong like in 2013. interesting enough, I found my result may be similar to Warren Buffett’s. Warren Buffet’s performance is 18.2% in 2013. Mr. Buffett said “Berkshire’s book value and intrinsic value will outperform the S&P in years when the market is down or moderately up. We expect to fall short, though, in years when the market is strong – as we did in 2013,” USA Today). In a strong market, while my long stock positions go up in value, so are my short call positions (the former goes up more than the latter), therefore, my performance won’t be as high as a pure long stock account. However, the increase in both stock prices and the call option prices make my covered calls deeper in the money, which increases the safety level of my account. In the future years when the market becomes weak, the deep in the money call positions will gradually become less deep in the money, and yielding higher returns in the years to come.
- Overall account has increased 765% since 2008.
- 2014: 10.85% (SP500: 13.4%)
- 2013: up 27.43% (SP500: 29.6%) (Warren Buffet’s performance is 18.2% in 2013).
- 2012: up 13.7% (SP500 up 13.3%), while only 39% of professional money managers outperformed the SP500.
- 2011: up 11.6% (SP500 was flat at ~0%), while 79% of professional money managers did worse than SP500. (CNN.com)
- 2010: up 91.41% (SP500 up 12.64%)
- 2009: up 247.13% (SP500 up 23.49%).
Source: SP500 performance (http://en.wikipedia.org/wiki/S%26P_500).
The above chart shows the change of my portfolio in relationship to SP500 and VIX between 1/1/09 and 8/31/11.
- My portfolio: 889% increase
- SP500: 140% increase
- VIX: Correlation between VIX and my portfolio performance is one research topic that I am interested in. This is because high VIX causes more rapid deterioration of option time value, hence a positive to my portfolio. But the higher the VIX, the greater the loss of my long stocks. I am learning to use VIX as one of the technicals to guide my investment (i.e., within a range, when VIX is high in a range, I go bullish, as it is now; but when VIX goes low I go bearish). I don’t see a significant correlation on the above chart yet, unfortunately.
The total return of my two trading accounts is up 33.87% so far this year, even after the awful gut-wrenching August! What did I do during the August crash? First of all, I didn’t sell any stocks. In fact, I even bought more stocks (wrote more covered calls). As a result, many of my stocks recovered and went above my call strike prices (such as bidu, pcln, mcp, slw, and lvs). Two of my stock holdings, crm and ffiv, have gone below my strike price. But CRM is now close to the strike price (strike is $130, and the stock is in 120s).
All in all, I didn’t lose much real value in my stock holdings. What’s lost is mostly the out of the money portion which doesn’t really hurt me anyways. Since January 2009, we have gone through several cycles of market downturns (“correction” or “flash crash” or whatever you call it). My results, once again, provide further evidence to support that my approach is a sound, money making strategy.
-updated 9/3/11.
My accounts is up by 15.7% (including the time values of the option positions that I have. For stocks like FFIV and CRM, I have options that are out of the money. These options show up on my accounts as negative. But they are out of money, therefore, these are definitely my money). I can say up to this point that my strategy has been weathering this market downturn pretty well. Remember, we are in August only. There are still many months that I can sell more options. But with more and more of my stocks out of money or at the money (PCLN), my protection is becoming smaller and smaller. I hope, as all the bulls out there, that the markets have seen the worst days this year. Good luck, bulls.
Updated 8/20/11
********************
My account is up by 25.8% this year until Aug. 5th (even after the 10% loss in SP500). This again shows the benefits of being disciplined and following your logic and reasoning, not knee jerk reactions.
How was I able to avoid the recent major crash with minimal damage? There is no trick to it. I have been holding these stocks for a very long time and the options (my hedge) of my covered call are deep in the money. I learned my lesson in the past: NOT to roll up the option strike prices too fast and too high, because markets will crash from time to time (actually it happens several times a year). I currently have BIDU (strike 105), CRM (strike 130), FFIV (strike 100), PCLN (strike 450), MCP (strike 50 and 55), LVS (strike 40), AND SLW (strike 33). All except FFIV are in the money, even after the recent big losses. It is very interesting to note that I rolled up PCLN’s strike very cautiously from 425 to 450 on 4/15/11, when PCLN was `$520/sh. Even with this deep in the money call, I was still able to sell an annualized time value about 45%. Now you see the reason I am so cautious and still make good money.
Updated: Aug 7th at 12 noon.
*****
I calculated the performance of my portfolio and adjusted it for deposits and withdrawals. Here is a brief summary.
2009: up by 247.13%
2010: up by 91.41%
2011: up by 11.6%
2012: up by 13.6%
Between Jan ’09 and July ’11: up by 810%.
I will draw some charts based on these numbers and I will update this performance regularly.
Updated on Aug. 4th, 2011
Posted in Account Performance
2 Comments
My portfolio is up ~30% so far this year.
Some of you know that I have been very interested in investments, esp. stock markets. I have also developed a system. Using this system, my portfolio went up by ~700% in 2009 and ~100% in 2010. 2009 and 2010 were 2 bull market years. As the saying goes, even a monkey can make money in a bull market. I had been wondering how my system would fare in a bear market. Well, be careful for what you wish for, you may actually get it. Not that I really want to test my theory, but 2011 has been a very choppy year with many features of a bear market. So how has my portfolio been doing? The following comparison gives me the confidence that my system appears to be a solid one. I have also done some preliminary research to show that my approach would fare better than S&P 500 index (The investment goal for most, if not all, fund managers is to “beat the market”), if you use to directly trade SP500 ETF. (I will publish this research later, when it’s completed.)
How are the market indexes, stock-fund managers and my portfolio doing so far this year? Let’s look at some numbers (Range spans from 1st trading day of 2011 until 12/9/2011).
- My portfolio is up +32%;
- SP500 (^GSPC) has lost 16.78 or -1.3%;
- DJIA (^DJI) has gained 513.51 (+4.4%).
- Nasdaq Composite (^XIC) has gained 44.67 (1.66%)
- Only 23% of stock-fund managers did better than S&P, i.e., 77% of stock-fund managers are in the red*.
*“Only 23% of stock-fund managers were ahead of the S&P this year through Nov. 30, according to Bank of America Merrill Lynch. This period ended with Wednesday’s 4% surge.” - Barron’s, December 3, 2011.
Posted in Account Performance
Leave a comment
WHX: Trusts: Profitable Or Principal Traps? Learn To Understand
One concern for the investor is when the investment runs out, there is no more income. Any assets remaining in the trust will be sold off and the trust dissolved. Important for the investor to know is how long the trust will remain, or will the income producer remain or run out? One particular trust I have written on in the past is Great Northern Ore(GNI).
GNI will terminate with the final payment in April 2015. When the trust terminates, the investors get their last check and the shares are worthless. The details are in the article, but knowing when to get out is important to a good investor.
With many commodities, another question is what are the effects on the price of goods, and how will the market affect them? Does the price go up or down? What are the many factors in the market? A simple example could be a hurricane effect on the oil producing Gulf Coast. Multiple storms through one season could drive the price way up, or damage wells belonging to the trust and cost millions in repairs. All of these are unknown future effects.
With many investments, trusts are evaluated daily in the market and bought and sold based on the perceived value. A trust with a higher rate of return may be signaling that the investment has some issues. In my opinion, a 10% return on your investment per year is good. Those that provide a higher rate sometimes indicate risk. Buyers would bid the price up if it were a great buy. The higher rates are not bad, but most should be seen for what type of investment they really are. Many trusts are smaller entities, with little to no ability to react and adjust their business operations because of the requirements written into the trust.
I have selected several trusts to highlight in this article and will write follow up articles as available. Trusts included here are WHX, WHZ, andCHKR, with SDT, PER, ECT, NYMT, MVO, NDRO AND ROYT displayed in the chart as other trusts with interests. In the chart I cover some basic information investors want to know.
(click to enlarge)
Whiting USA Trust I (WHX) was formed in October 2007, by Whiting Petroleum Corporation. Whiting Petroleum Corporation’s wholly-owned subsidiaries, Whiting Oil and Gas Corporation and Equity Oil Company, conveyed a term net profits interest to the trust that represented the right to receive 90% of the net proceeds from Whiting’s interests in certain existing oil and natural gas producing properties. The net profits interest entitled the trust to receive 90% of the net proceeds from the sale of production of 9.11 million barrels of oil equivalent (MMBOE), which is equivalent to 8.20 MMBOE attributable to the net profits interest, after which the trust will terminate. In the company quarterly report, as of September 30, 2013 on a cumulative accrual basis, 6.86 MMBOE (84%) of the Trust’s total 8.20 MMBOE have been produced and sold (of which proceeds from the sale of 260 MBOE, which is 90% of 288 MBOE, will be distributed to unitholders in the Trust’s forthcoming November 2013 distribution) and a cumulative reserve quantity of 0.02 MMBOE have been divested. The remaining reserve quantities are projected to be produced by June 30, 2015, based on the reserve report for the underlying properties as of December 31, 2012.
At the currently estimated end date of Jun 2015, the trust will pay 7 more dividends. The last dividend was $0.534, making the estimated total payout of $3.73 until the termination of the trust. With the stock price at $6.30 today during midday trading, I would look to this stock as overpriced and stay clear of this investment. The price should decrease every quarter until June 2015, when it should reach zero. To buy in, the price would need to be $3.00 or below to get my initial capital back with a 10% return.
Posted in Uncategorized
Leave a comment
AGNC: a great candidate for dividend + option premium strategy
AGNC pays 13.31% dividend. What’s more interesting is this is also a weekly option stock with high liquidity.
I wrote a covered call of AGNC with a net debit of 23.58 for a call strike of 24 (exp. Sept 27th). With 8 days to expire, its annualized return is ~80% [(.42/23.58 x 100% / 8 (days) x 365 (days) = 81.2%]. The actual annualized return is more like 270%, since the margin requirement is only 30% for AGNC.
I plan to keep this stock for longer term (to receive dividend). So I’ll do a credit spread when the option expiration nears.
9/26/13
Most (70%) of my agnc options were exercised today (obviously the call buyer wanted to received dividend, since today is the ex-dividend day), including the calls that expire in Oct which still has a sizable time value. Not surprisingly, AGNC went down about $0.80 at the open today b/c AGNC goes ex-dividend today.
Posted in Daily Journal
Leave a comment
CYS
CYS is a high dividend paying stock ($0.34/sh with a dividend yield of 16.77%). It’s ex-dividend date for this quarter is Sept. 20th. I wrote a covered call for CYS today, with the option to expire on Sept 21st. The strike is 7. Current stock price is 8.09. The stock may fall 0.34 at the open on the ex-dividend day which is why I chose $7 as the strike. The concept is to capture the $0.34/sh dividend, while limiting the downside risk.
This is a test of my short term, high dividend and optionable stock strategy. The dividend is paid on Oct. 16th.
Posted in Daily Journal
Leave a comment
A strategy to cash in on both Dividend + Option Premium
When a dividend paying stock also has options, one way to cash in on both the dividend and the option premium is to write an ITM covered call right before the ex-dividend day.
Take WHX. WHX’s Sept. 13 calls for 2.5 strike was 2.65 and for 5 strike was o.2. If one writes a covered call for strike 2.5 before the ex-dividend day (Aug. 15th), buy 10000 shares WHX at 5.11, sell 100 contracts of Sept. 13 call at strike 2.5 for 2.65. Net debit: $2.46 x 10,000 (1 contract = 100 shares) = $24600. Dividend payment is $0.53/share x 10000 = $5300. By Sept. 13, if WHX price is above $2.5, the shares are called away (at $2.5/share), the net result is: $25000 – $24600 + $5300 = $5700. 5700/24600 = 23%. The margin requirement is about 30%, so the net return is 23% x 3 = 70% in one month.
The call strike should be greater than the sum of (the current stock price – dividend). The Stock price may drop by the amount of the dividend on the ex-dividend day, but if the stock price is still above the call strike, one can allow the stock shares to be called away while keeping the option premium and the dividend.
Note: one thing to watch with this strategy, however, is the call away of stocks before ex-dividend date. Most of the high dividend stocks don’t have much option time value. Only stocks with high dividend and high option time value are good candidates for this strategy.
Dividend Calendar: http://www.thestreet.com/dividends/index.html
Posted in Trading Strategy
Leave a comment