Bought 50 ANR May 3 2013 7.5 Put @ 0.45.
Closed on May 3rd at 11 for a loss of $920.76.
Bought 50 ANR May 3 2013 7.5 Put @ 0.45.
Closed on May 3rd at 11 for a loss of $920.76.
Typically a stock is considered a good value if it is trading near its 52-week low. However, make sure the stock is on a rebound if it is near the low, because it could always drop farther and create a new low. Don’t get caught in the assumption that a stock can’t possibly go any lower. A stock can always go in either direction, no matter how much the price has fallen. On the other hand, if a stock is trading near its 52-week high, it should probably be avoided because it will likely hit a resistance level and shoot downward.
Volume is the number of stocks bought and sold in a single day of trading. Make sure the average volume of the stock is over 50,000 or so. If the volume is low, then liquidity is low. This means it is hard to buy and sell because there aren’t many buyers and sellers and the stock moves in a very choppy fashion. This creates a lot of unnecessary volatility, which most traders generally avoid. This is the unfortunate scenario often involved with trading penny stocks.
The PE ratio is a critical number in evaluating stocks. The formula for finding the PE ratio is a simple one: Price per share/Earnings per share. So if the price of the stock is $2 and the EPS is $1, then the PE would be stated as 2.0x. It is unnecessary to remember this formula since the PE ratio is always listed on the “quote page” of a stock. The reason for the formula was to show the relationship between the numbers, and also give an idea of how to tell if a stock is over or undervalued. Think of undervalued as underpriced and overvalued as overpriced. This means if the PE is very high, then the price per share of the stock must be much more than its earnings per share, which means the stock is overvalued, or overpriced. The opposite is true if the PE is low. So basically, it is beneficial to look for companies with low PE ratios between the range of 1.0x and 10.0x. When the market is performing better, the preferable range would be increased to around 10.0x and 20.0x. Also if the company has a negative earnings per share, then the PE will not be listed.

EPS is determined by the following formula: Net Income – Dividends on Preferred Stock/Average Number of Shares Outstanding. It breaks down the profit, or earnings of a company in terms of individual shares. Investors should look for positive earnings as well as consecutive growth over each quarter. If a company fails to meet the earnings expectations of analysts, it instantly decreases the stock price when the actual earnings are announced. EPS has one fatal flaw. A company’s accounting department can easily manipulate it. However, it should still carry some weight in choosing a stock nonetheless. A similar measure that has grown increasingly popular is cash flow per share or CPS. Accounting may be able to hinder earnings to look more favorable, but cash is impossible to manipulate. CPS gives a true account of how much cash a company really has on hand, and how effective its operations are. This is a crucial statistic in itself to determine if there is enough cash to pay off debt and engage in future endeavors that contribute to stock price increases. Look for a company that has both positive EPS and CPS.

Market cap is determined by the following formula: Number of Shares Outstanding x Price per share. Remember that owning a stock is actually a partial ownership in the company. If someone were to buy the entire company, they would have to buy all of the stock. The market cap could be thought of as the overall price to buy out a company. The market cap is used to classify the size of the company into one of the following categories: nano, micro, small, mid, large, and mega caps. The large and mega caps are worth billions of dollars, while the micro and small caps my only be worth several million dollars. Basically, the larger the company is, usually the more stable and safe it is. There are exceptions such as GM and Enron, of course. Think of the sizes and the stability of stocks as trees. The nano cap could be compared to a small maple tree that is violently blown around in storms (market crashes) and could be easily uprooted (bankruptcy). The large caps are like mighty oaks that can withstand many violent storms with little damage. However, the small maple tree can grow several feet over a few years, while the large oak has matured and fosters little potential for extreme growth. Basically, when investing, look at the market cap or size classification to find something that matches your risk tolerance. The smaller the company the more potential growth, and the more possible risk. The opposite is true of large companies.

Beta is an indicator of a stock’s standard deviation, or volatility. It is somewhat difficult to calculate, but is provided on many websites. The calculation involves taking the standard deviations of the monthly returns of the particular stock along with the S&P 500’s monthly returns for five years within the same time horizon and inserting the two standard deviations separately into an overall variance formula and dividing by the population variance. Actually, using beta is much less complicated than its calculation. If a stock has beta of 1.0 it moves in congruence with the market. This means if the S&P 500 goes up 1% in a day, the stock should go up 1% in a day. The opposite is true if the market goes down. If the beta is 2.0, and the market increases by 3%, then typically the stock will go up 6%. Sounds great until the market drops 3% and the stock falls 6%. If the beta is negative then it moves inversely, or opposite of the market. Very few stocks have negative betas. Typically, large blue chip companies will have the lowest betas. Microsoft is normally around a 0.9 or 1.0, moving with the market. Pfizer is usually a 0.8 beta; meaning if the market goes up 1% it will only increase 0.8%. Casinos usually have the highest betas. The Las Vegas Sands is currently a 4.7. Beta is really a double-edged sword. Theoretically, an investor could make the quickest, and most significant gains with a high beta stock, but could lose the most as well if the market underperformed. If you like to watch your money move like crazy from day to day, I would recommend a high beta. If you like to play it safe and preserve your money, I would recommend searching for a low beta that has little volatility.

Dividends are cash paid per share by companies to reward their shareholders for holding their stock. They are comparable to coupons on bonds, except they are not as much. When investing in a company, check to see if they are currently paying a dividend. If a company has money to hand out, then they are usually doing well. The companies that pay the highest dividends often have steady growth also.
Many stocks offer options contracts for buying and selling in the future. An investor doesn’t have to understand options to take advantage of this following tip. When researching a stock on a financial website, there is typically a link for options chains. These are simply the options available for the stock. They are often listed in “T” shaped boxes with call options (the right to buy the stock) on the left and put options (the right to sell the stock) on the right. The strike prices are listed down the center of the “T”. These prices give a range in which the stock is expected to move. Both the call and put sides have open interest columns; this is the key. The people in the open interest column on the left are bullish; they think the stock price is going up. The people in the column on the right are bearish; they think the price is going down. There is a different amount of open interest for each expected price. Basically, look for stocks that have more open interest on the call side than the put side. This shows that more people want to buy the stock in the future than sell it. It is worth getting a second opinion, or in this case, thousands of opinions when purchasing a stock.
 that believe it will reach $30 and only 770 who think it will not break $30. This gives us a nice idea of future price expectations.")
Take note of what is happening inside of the company itself. If the CEO just dumped 50,000 shares, it may be time to get out. The insiders know the company better than any analyst. If the number of shares bought by individuals inside the company has been increasing, it may be a good time to buy.

News affects the expectations and decisions of the investing public and expectations determine stock prices. Popular glamour stocks such as Yahoo or Apple are always in the news, and the prices are sometimes inflated by the hype of the press. Try to choose stocks that are not the victim of newspaper publicity and television headlines, and there’ll be much smoother sailing.
1. Make sure the stock is trading closer to the 52-week low than the high and also has upward momentum.
2. Average volume should be around 50,000.
3. The PE ratio should be somewhere between 1.0x and 10.0x.
4. Earnings and cash flow per share should both be positive with positive growth over each quarter.
5. There is no specific market cap to look for, just be aware of the risk/reward trade off of each size and their stability as well. (Personally, all of my highest returns have come from mid caps.)
6. Beta is much like the market cap, in that there is no specific beta to look for. It just depends on risk tolerance. However, if you have a longer time horizon to invest, I would recommend a higher beta and vice versa.
7. Look for stocks that offer dividends. Dividends are usually, but not always, a sign of good financial health.
8. Look at the open interest on options chains for a specific stock to see how many people are planning on buying and selling and at what price. This basically serves as an opinion poll on the stock’s expected performance.
9. Always consider the amount of shares CEOs and other executives are buying and selling, to get an accurate picture of what is happening on the inside.
10. It may be a good idea to avoid stocks that are constantly in the news. Stock prices will often reflect the investors’ perception of the stock, which is usually not an accurate evaluation of the underlying company. The dot com bubble in the 90’s is a perfect example.
Five days ago, I adapted a new stock screening strategy to combine fundamental and technical parameters to select stocks for my modified covered call strategy. I set up covered calls on 3 stocks from my list: CRM, KORS and V.
1. CRM: CRM closed above my strike (175) with a gain. The call was in the money, so I did a credit spread (BTC 175 3/22 and STO 175 3/28) with a credit of 1.58. The weekly gain on CRM is 4%. CRM fundamental didn’t change much. The only technical parameter that changed is the RSI (>50%) on Friday. I kept the stock.
2. KORS: This stock needed down by Friday, but the options expired with a gain. Overall, there is a 1.2% loss on the week. Kors fell below SMA50. On Monday, if KORS is able to go back above SMA50, I’ll keep it and sell another call. If not, I’ll sell it.
3. V. Before the closing bell on Friday, V shot above 160, my strike. I tried to roll out the calls, but didn’t have enough time. So V is called away with a nice profit (~1.68% gain in 5 days or ~122%/yr).
Next week. I need to replace the expired calls and set up new ones. V is no longer on the FinViz.com chart (V’s RSI is >50 now). I will find a replacement for V.
Schaeffersresearch.com: great weekly market analysis
StockCharts.com: great technical analysis tool
ChartAdvisor.com: brief weekly technical analysis of the overall market
FinViz.com: excellent stock screening tool (providing both fundamental and technical parameters.
Stock screeners are useful tools to screens stocks. I use FinViz.com. I used the following criteria to select stocks for my covered call:
Sometimes FinViz.com will give you a very long list based on the criteria I enter. In that case, I may change the selecting criteria (e.g., increasing dividend to 10%) to narrow the list down to a manageable 10 or less. Then I use a spreadsheet to compare the percentage of option premium using at the money call to determine which stock has the most time value. Finally, I choose stocks that have the best annualized return (option time value + dividends).
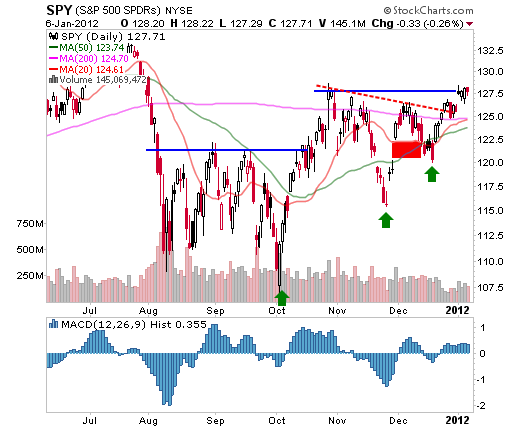
Schaeffersresearch.com: “Potential short-term resistance for the SPX is at 1,320, the site of the pre-Lehman Brothers high in 2008, and 1,345-1,350, which was the site of resistance in 2011. Short-term support is in the 1,285-1,290 area, site of a late-October peak.”
ChartAdvisor.com: “…It would be very difficult for the markets to stage an extended rally from this point, so some consolidation or pullback remains likely. If the pullback is tame, it could set the stage for a healthy rally moving forward.”
ChartAdvisor.comt: The bottom line is that the markets are still truly at a crossroads. There has been some very positive price action as many indexes have cleared some significant resistance levels and intraday price action this week was positive. Buyers have been stepping up and selling pressure has been fairly light on pullbacks. However, overall, the markets are overbought while still near critical areas of resistance. The pullbacks have been swift and severe over the past few months and it would not be shocking to see one in the coming weeks. That being said, overall the market’s price action has improved somewhat, and could be signaling a healthier intermediate trend.
Schaeffersresearh.com: bullish with a possible near term pullback
An options strategy whereby an investor holds a long position in an asset and writes (sells) call options on that same asset in an attempt to generate increased income from the asset. This is often employed when an investor has a short-term neutral view on the asset and for this reason hold the asset long and simultaneously have a short position via the option to generate income from the option premium.
This is also known as a “buy-write”.
For example, let’s say that you own shares of the TSJ Sports Conglomerate and like its long-term prospects as well as its share price but feel in the shorter term the stock will likely trade relatively flat, perhaps within a few dollars of its current price of, say, $25. If you sell a call option on TSJ for $26, you earn the premium from the option sale but cap your upside. One of three scenarios is going to play out:
a) TSJ shares trade flat (below the $26 strike price) – the option will expire worthless and you keep the premium from the option. In this case, by using the buy-write strategy you have successfully outperformed the stock.
b) TSJ shares fall – the option expires worthless, you keep the premium, and again you outperform the stock.
c) TSJ shares rise above $26 – the option is exercised, and your upside is capped at $26, plus the option premium. In this case, if the stock price goes higher than $26, plus the premium, your buy-write strategy has underperformed the TSJ shares.
Courtesy of Investopedia.com.
Read more: http://www.investopedia.com/terms/c/coveredcall.asp#ixzz1j7NMLxNP
|